A. Overview:
- ONGC is having huge annual procurement of various kinds of materials like Capital goods, Spares items and store items. Huge amount of data is generated while procuring these goods and analysis of this Data can be useful in re-inventing procurement strategies for the future with limited resources for an overall increase in efficiency and betterment of the Company. For this Analysis PO data from the past 5 years viz. FY 2017 to Feb 2023 has been used from Western Sector (Ankleshwar, Ahmedabad, Vadodara, Cambay, Mehsana & Jodhpur). Data has been processed using traditional Unsupervised Learning techniques of Machine Learning. The k-Means Clustering algorithm has been used to create clusters of all the materials procured during these last five years. Clustering is the task of dividing the population or data points into a number of groups as per the use case such that data points in the same groups are more similar to other data points in the same group and dissimilar to the data points in other groups. It is a collection of objects based on similarity and dissimilarity between them.
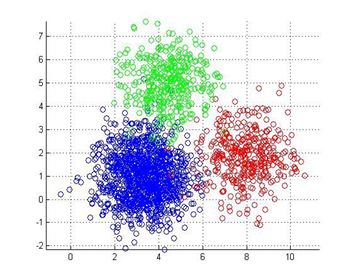
In the Figure above three colours are representing three different clusters
- For Clustering these major parameters/features have been used in instant case:
- Cumulative contract value procured for a particular material
- Frequency of purchase of a particular material
- No. of assets where a particular material has been procured
B. Data Pre-Processing:
- On loading data for the last Five Years there were around 1,11,422 no. of line items of materials being procured in the Western Sector. The PO data was having huge noise as brought out below and the same was cleaned before processing further.
- Contract value of a few POs was in USD (Import cases) and the majority of POs were in INR. The same was brought on similar terms.
- Data included POs from MM and Indentor level cases, so data needed to be segregated to have MM cases only.
- Data had different types of materials viz. Capital goods, Spares items and store items including various chemicals. The analysis had to be performed based on the type of material, thus data was segregated based on the type of material.
- For Analysis, only data corresponding to Open and Limited tenders were considered, so data pertaining to OEM/OES/PAC/Nomination had to be deleted.
- Many POs were not released in SAP, so those POs had to be removed from the final data.
- Many POs were actually marked as deleted in SAP; those POs had to be removed from the data.
- It was difficult to ascertain which PO pertains to which Asset, so mapping of PO line items against Asset/Work Center/Basin was done.
- Further, for the same Mat code and with the same PO No. there are multiple line items against the same tender, probably because PR had multiple line items of the same material meant for different consignees/Departments/sections/lots/based on annual consumption etc.. In order to count this kind of purchase only once, these line items were clubbed together and their respective contract value was aggregated.
- Further, there were many line items for the same material issued by a particular Asset within a short period. It is safe to assume that all the POs have been issued against the same tender either due to splitting or due to extending benefits of the PP-MSE/MII policy. All such cases should be counted as one as orders have been made using the same tender. Now in the case of E-tender, we can easily segregate such cases using Collective No. (Tender No.), however in the case of GeM tenders since tender No. is not maintained in SAP. It is assumed that within 30 days of placing an order for the same Mat Code and asset, another contract for the same Mat Code and asset during this duration must be against the same tender either due to splitting or due to extending benefits of PP-MSE/MII policy. Therefore, the same was counted only once for calculating frequency.
- After incorporating all the above steps, data was cleaned and data was categorised into three different categories namely Capitals goods, Store items, Spares items.
C. Processing of Data pertaining to Capital Goods Items:
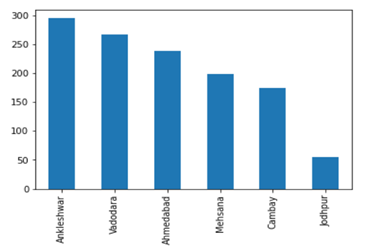
- After cleaning data final PO data of Capital Goods is having 1,287 line items from different Assets as under:
- Thereafter, a separate Clustering Dataset is created considering material-wise total cumulative contract value, frequency of purchase and no. of assets where the material was procured.
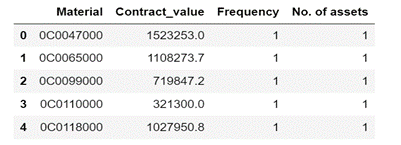
Random five items in Clustering Dataset
Contract Value: Cumulative contract value for a particular Material in the last five years
Frequency: No. of times a particular Material was procured in the last five years
No. of Assets: No. of Assets who have procured a particular material in the last five years
- Subsequently, the tendency of clustering was ascertained using the Hopkins test. As per Hopkins test score is 0.96 which implies there is a high tendency of clustering.
- Further, the no. of clusters was ascertained using the Elbow curve and Silhouette score and the optimal no. of clusters came to be 3 clusters.
- Accordingly, the K-means clustering algorithm is implemented and data was divided into three different clusters.
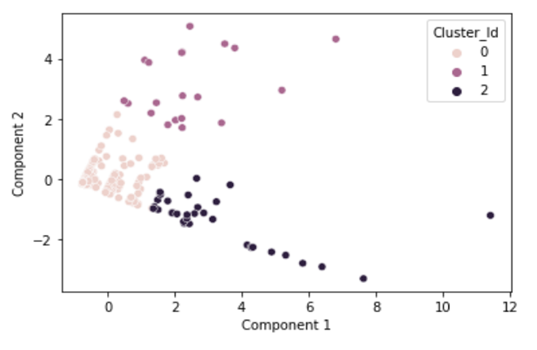
- As different parameters were used to create clustering, to visualise clusters in 2D instead of 3D data, Principal Component Analysis (PCA) was performed to convert 3D data to approximate 2D data. Accordingly, the visual interpretation of clusters is as under:
Note:
Components 1 & 2 above basically represent contract value, frequency and no. of Assets where the material was procured in two Dimensional spaces in order to visualise three Dimensional Data.
- For further visual interpretation Boxplot has been used. A typical boxplot can be read as under:
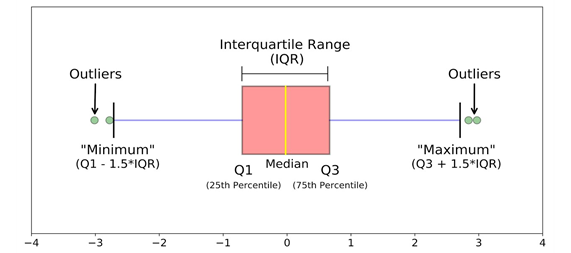
The figure above shows a typical structure of a Boxplot
- Visual representation of clusters using all three parameters is as under:
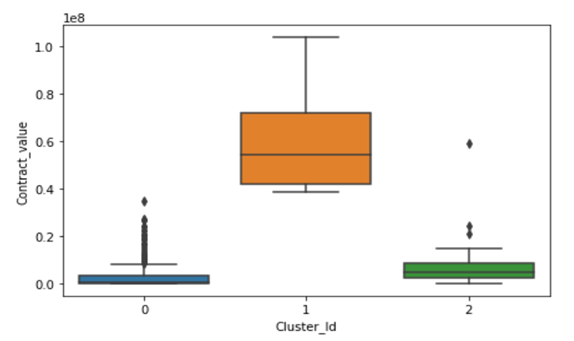
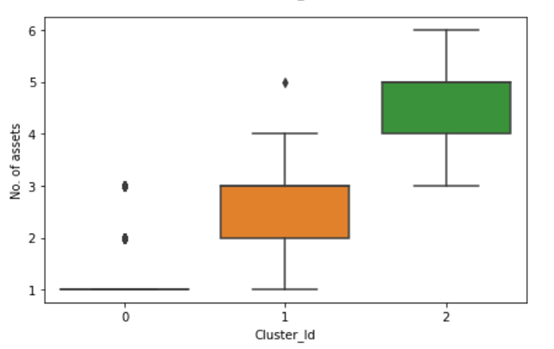
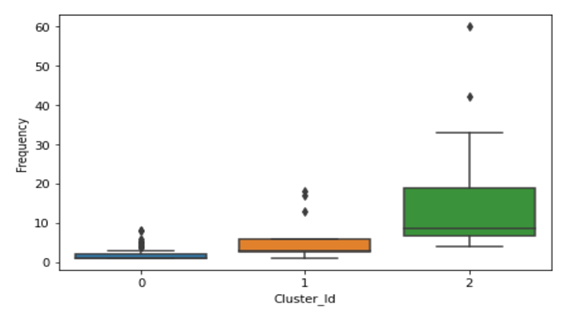
- Interpretation of Clusters:
Cluster 0: This cluster contains Capital items with low cumulative contract value, low frequency and procured in a very less no. of Assets/Work center/Basin.
Cluster 1: This cluster contains Capital items with high cumulative contract value, moderate frequency and procured in moderate nos. of Assets/Work center/Basin.
Cluster 2: This cluster contains Capital items with moderate contract value, high frequency purchase and procured in maximum nos. of Assets/Work center/Basin.
From a Business point of view, Cluster 2 and Cluster 1 are the most important and materials in these clusters can be used for procurement through centralisation/empanelment.
- Materials in Clusters:
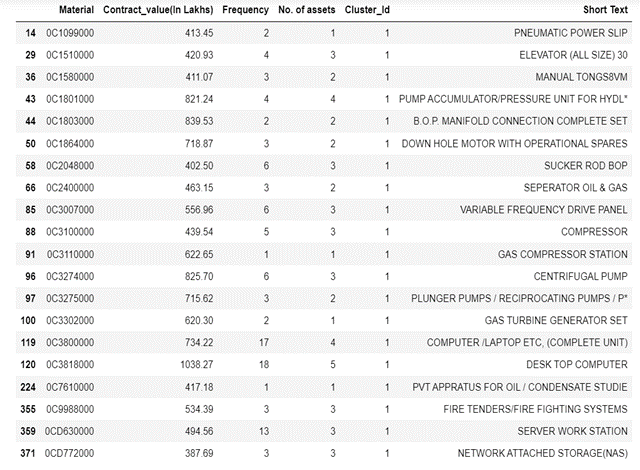
This is perhaps the most important step from a business point of view to understand which materials are in which clusters. Materials in Cluster 1 & 2 are as under:
Materials in Cluster 1
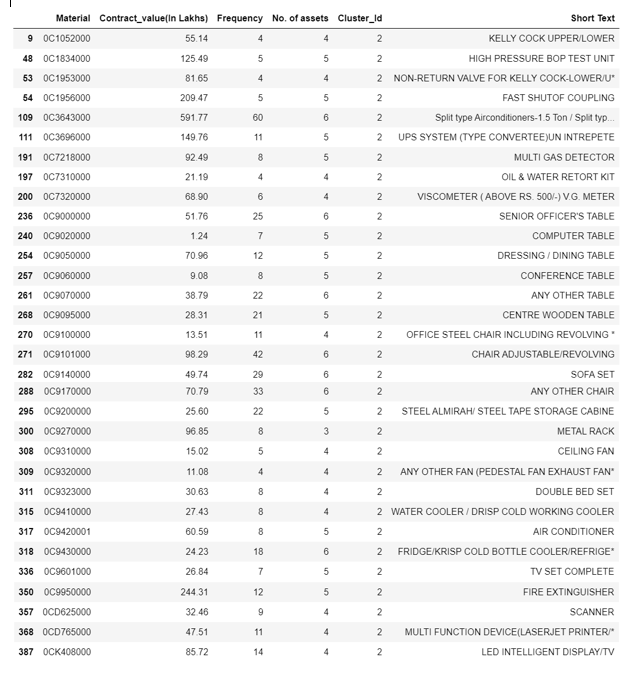
Materials in Cluster 2
D. Conclusion:
- For any organization including ONGC, in the present business scenario Data Analytics has become a must to increase efficiency with less no. of resources to remain relevant in the industry amidst ever-changing market and Government directives.
- PO data from the last five years for capital goods are clustered in three clusters. Among these clusters following has been observed:
- Cluster 0: This cluster contains Capital items with low cumulative contract value, low frequency and procured in very less no. of Assets/Work center/Basin
- Cluster 1: This cluster contains Capital items with high cumulative contract value, moderate frequency and procured in moderate no. of Assets/Work center/Basin.
- Cluster 2: This cluster contains Capital items with moderate contract value, high frequency purchase and procured in maximum no. of Assets/Work center/Basin.
- Materials from Cluster 1 & 2 can be considered for centralisation/empanelment to reduce no. of cases of similar type and get benefits of economy of scale by clubbing similar goods. Even though some items are of the low contract value in Cluster 2, however, these items are repeatedly procured at the cost of resource efficiency.
E. Future Work:
- In the above paper clustering algorithm has been performed only on Capital items, similar analysis can also be performed on Store items and Spare items of the Western Sector as well as data from other regions which can assist in implementing various procurement strategies.
- Unit price Analysis can also be performed where median unit prices for all the Materials in all the Assets/Basin in the Western region can be compared to check for any pattern or identify goods with significant differences in prices.
- Inventory Data Analysis
F. References:
- P. Anitha, M.M. Patil, RFM model for customer purchase behavior using K-Means algorithm. Journal of King Saud University-Computer and Information Sciences, 34 (5) (2019), pp. 1785-1792
- A. K. Jain and R. C. Dubes, Algorithms for Clustering Data, Englewood Cliffs, NJ, USA:Prentice-Hall, 1988.
- Ding, Chris; He, Xiaofeng (July 2004). "K-means Clustering via Principal Component Analysis" (PDF). Proceedings of International Conference on Machine Learning (ICML 2004): 225–232.
- Jolliffe, Ian T.; Cadima, Jorge (2016-04-13). "Principal component analysis: a review and recent developments". Philosophical Transactions of the Royal Society A: Mathematical, Physical and Engineering Sciences. 374 (2065)
- Jennifer G Dy and Carla E Brodley. Feature selection for unsupervised learning. Journal of machine learning research, 5(Aug):845–889, 2004.
Data Source:
- PO Data from SAP (ME2N)
Libraries/Technologies used:
- Jupyter Notebook
- Numpy
- Pandas
- SkLearn
- Matplotlib
- Seaborn
Contact:
- Created by Rohit Chaudhary, Sr. MM Officer, Ankleshwar Asset
Please feel free to comment/contact me for any suggestions/improvement
Email: chaudhay_rohit@ongc.co.in